WALT - create and understand line graphs using data from a tally chart
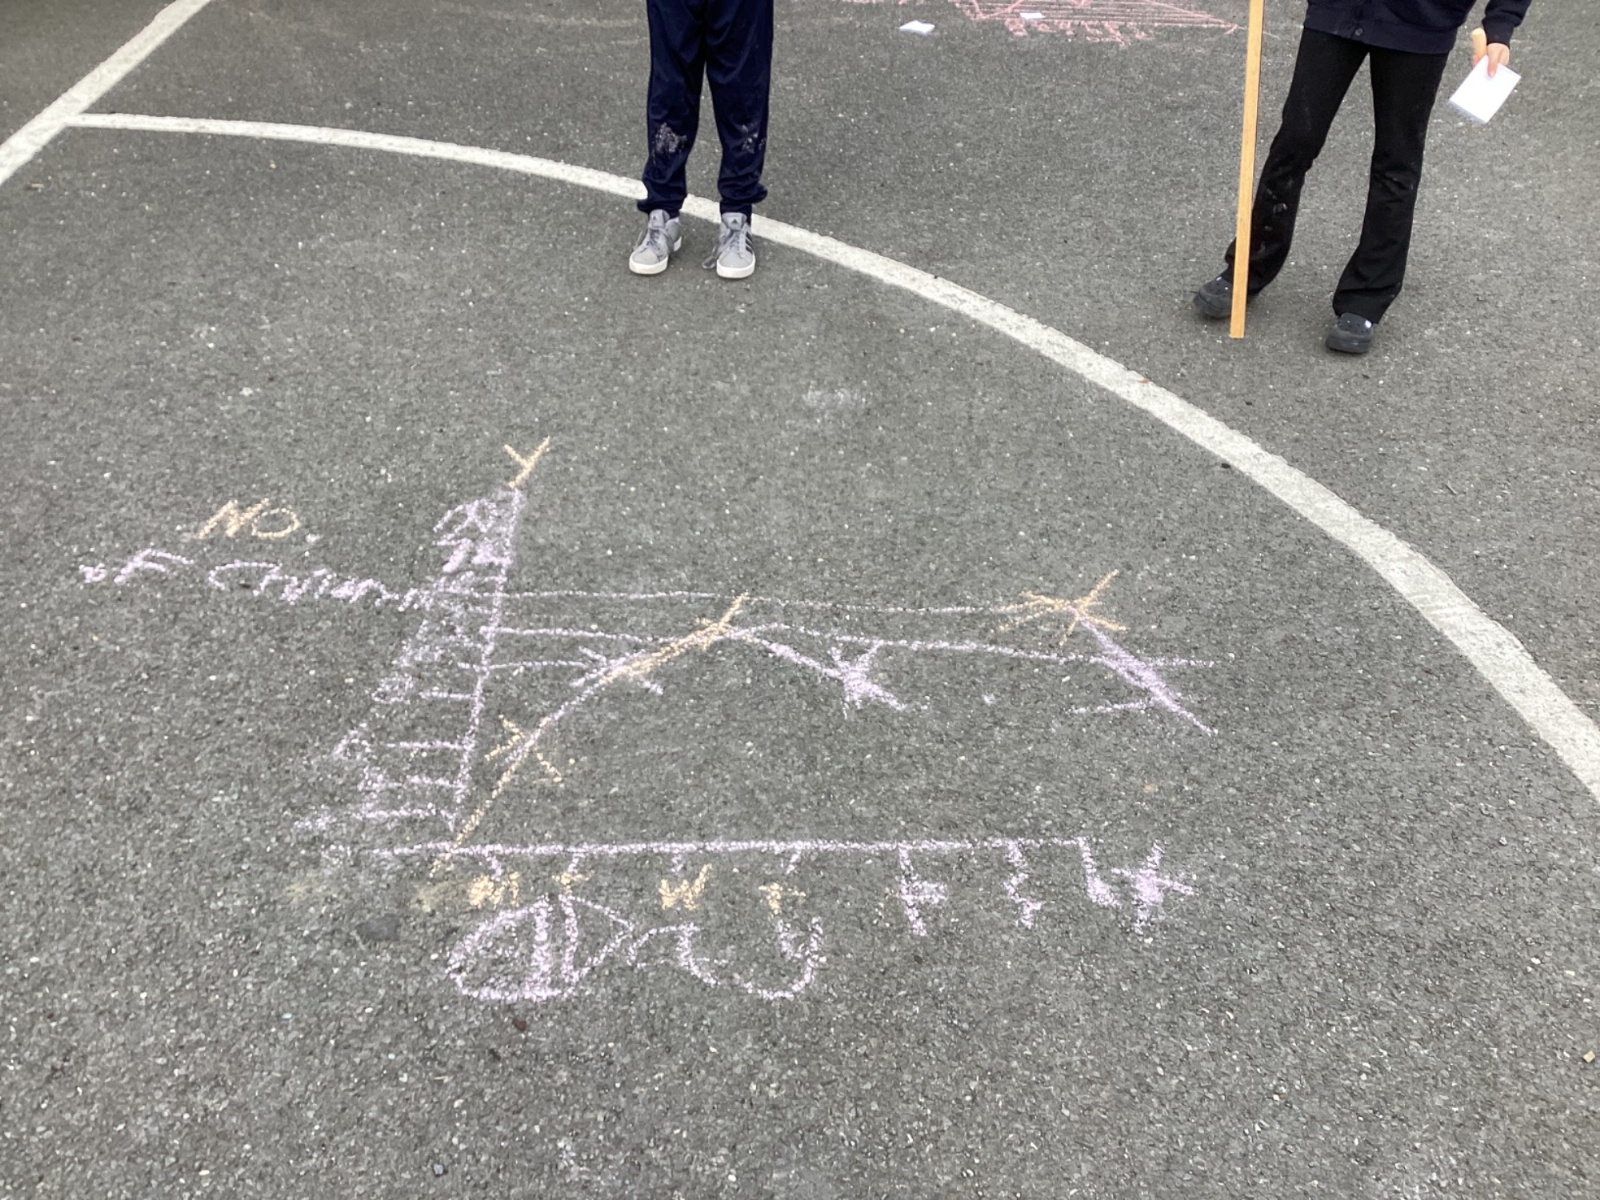
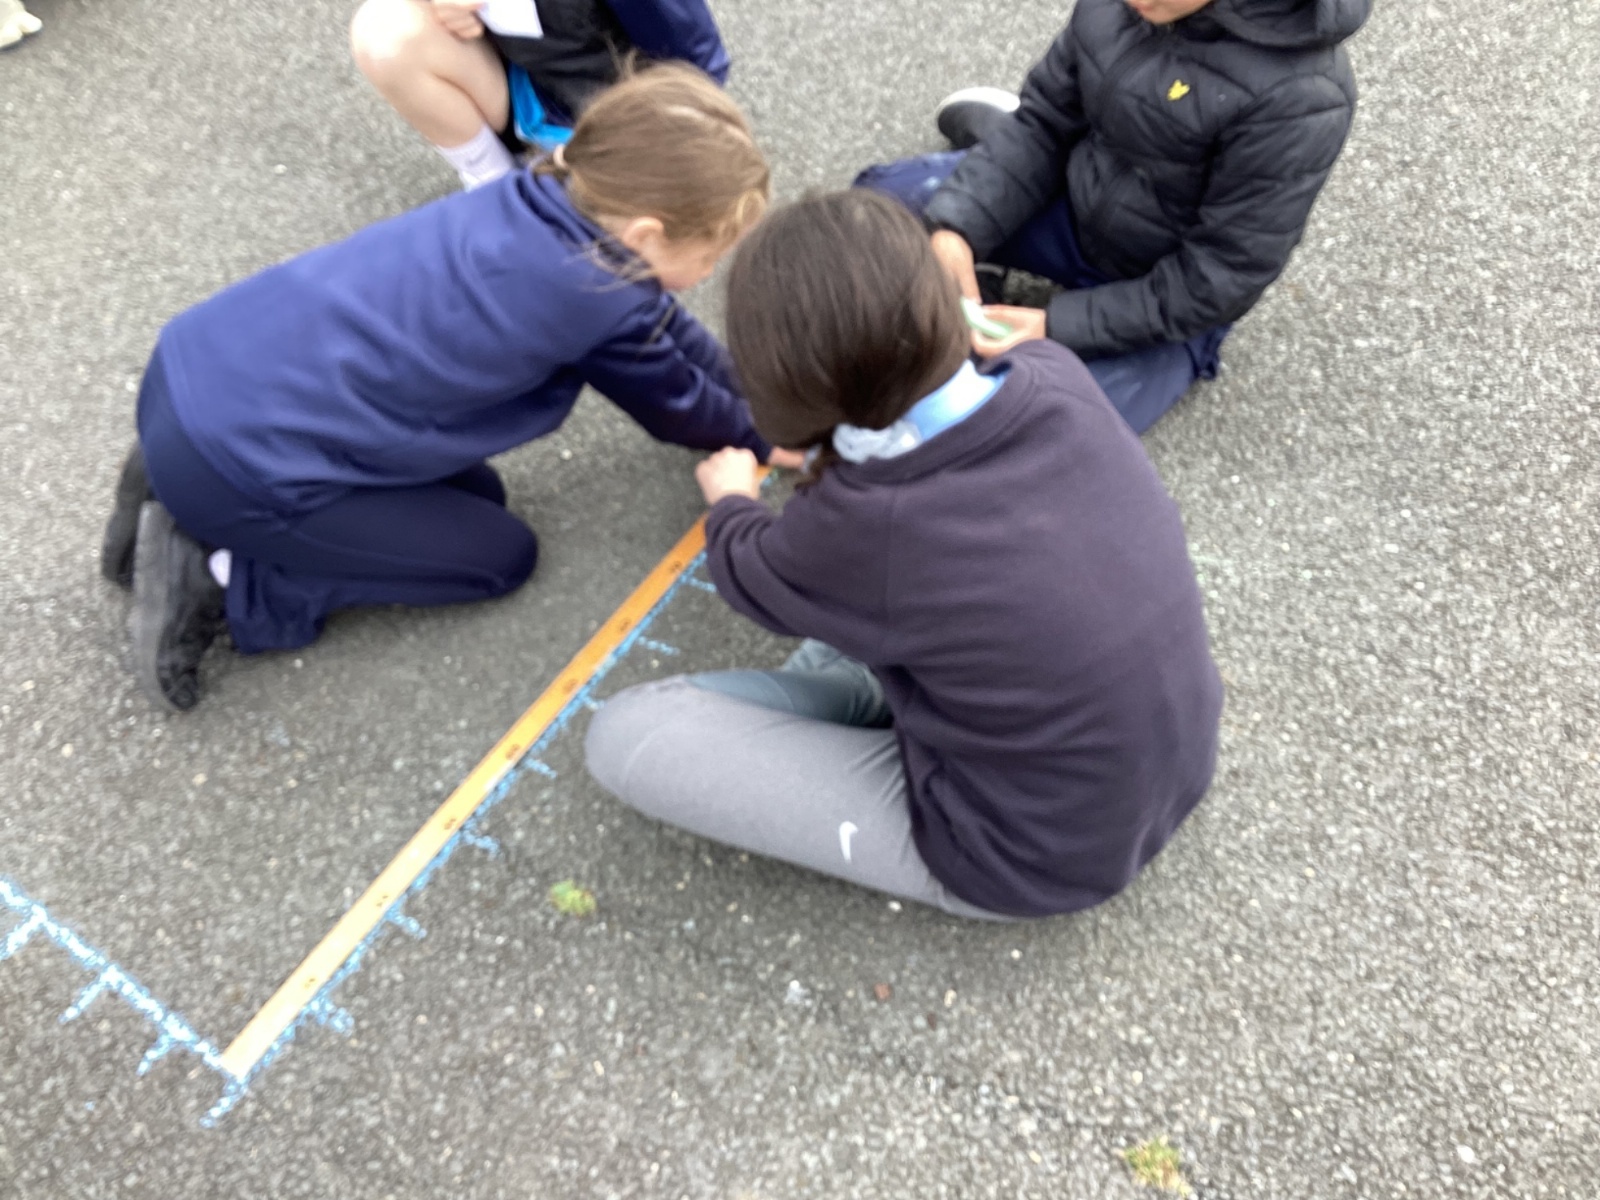
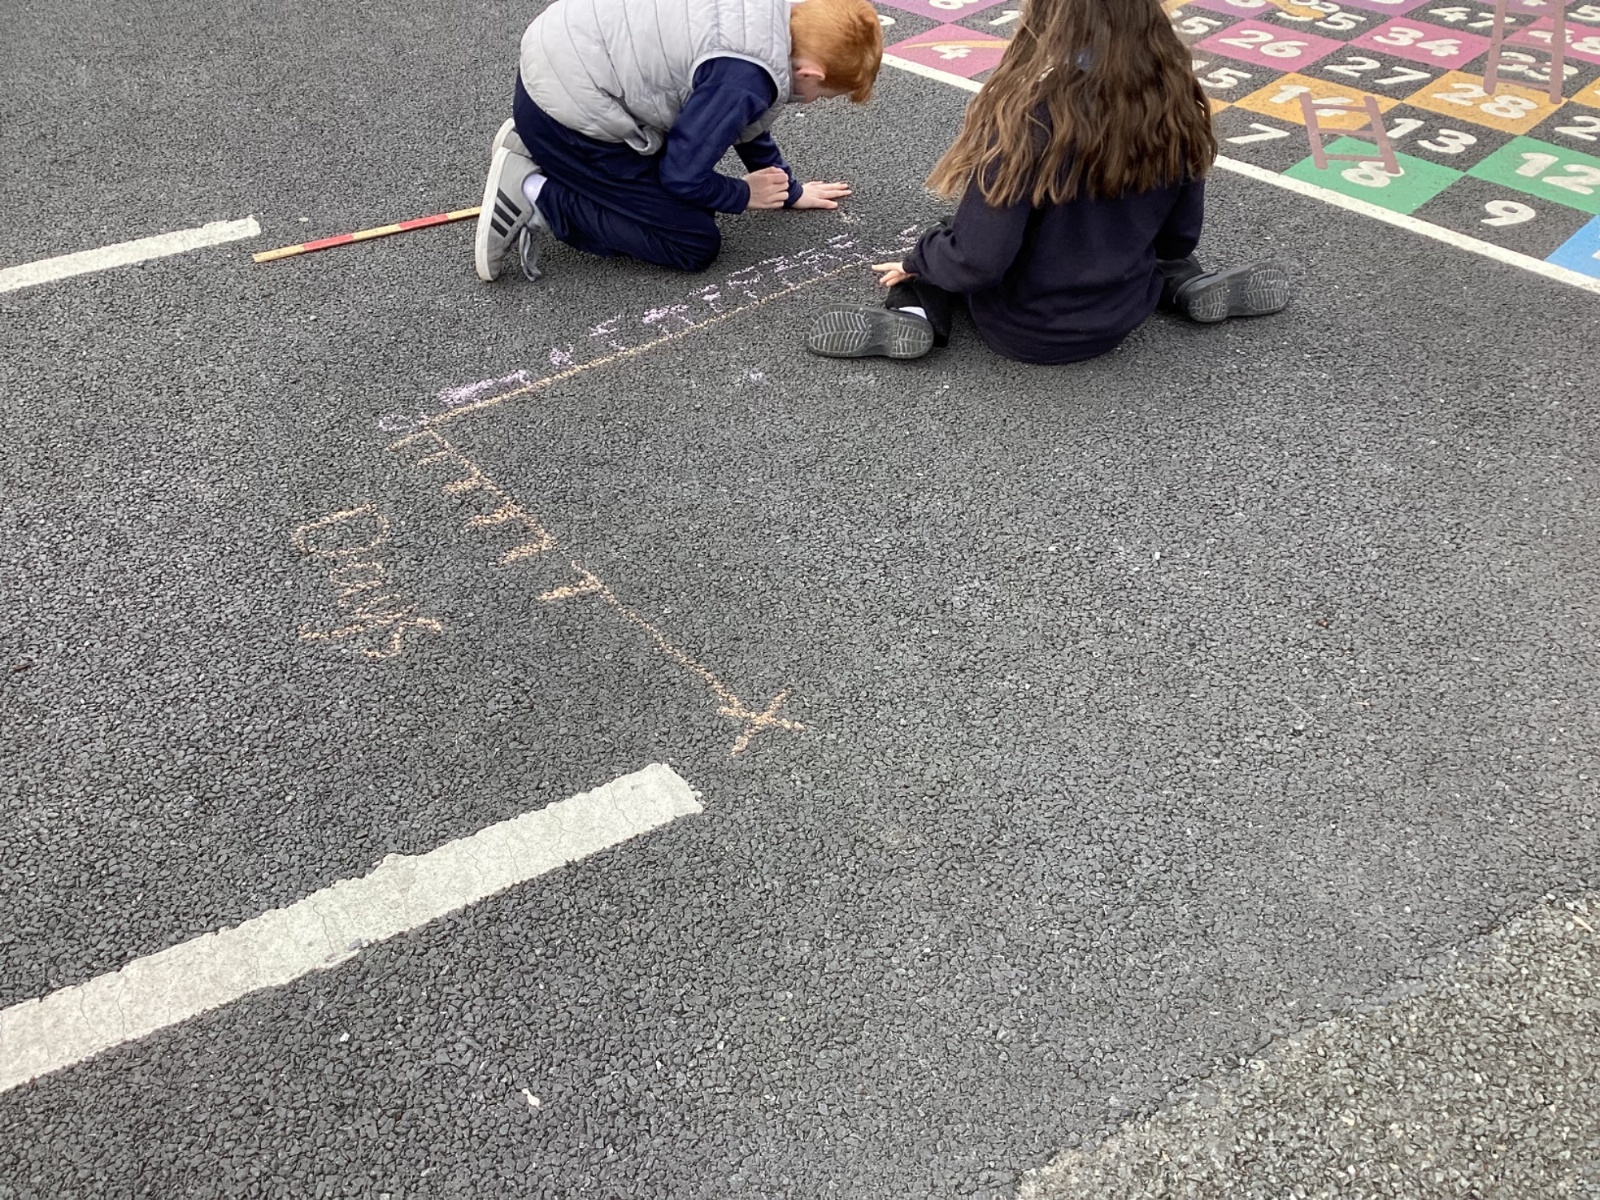
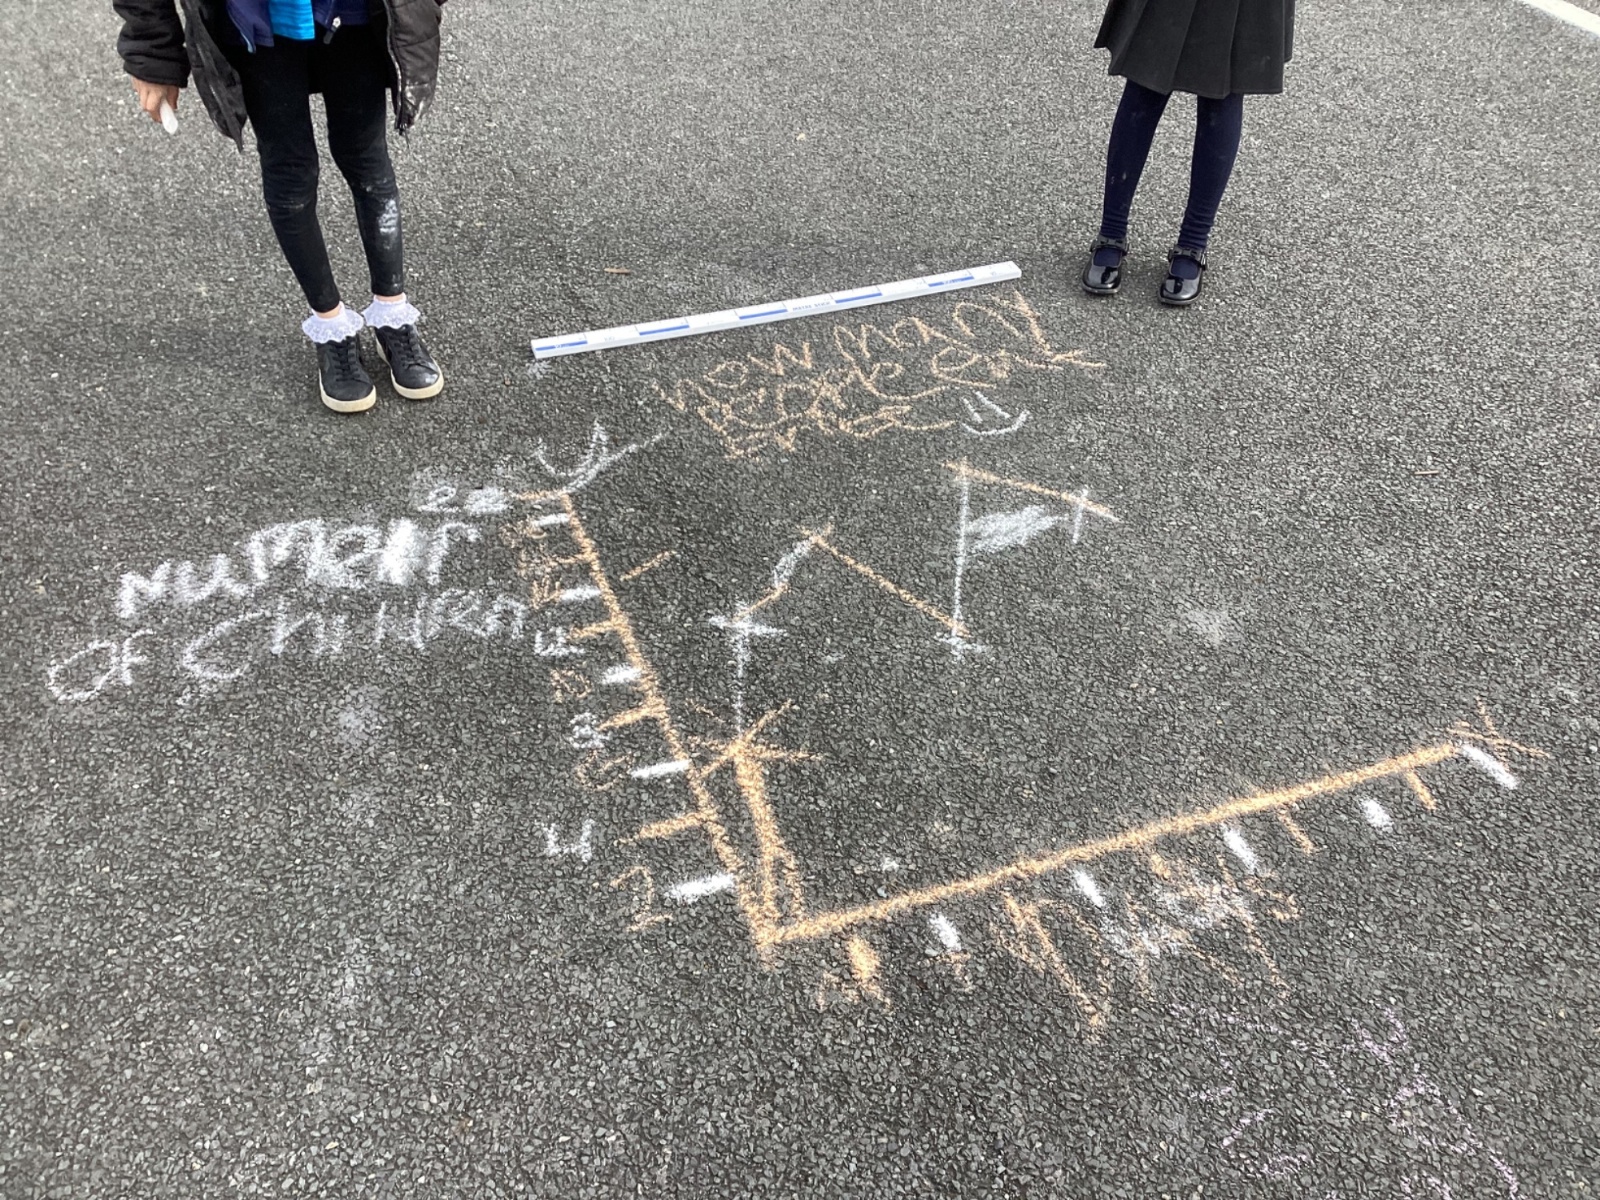
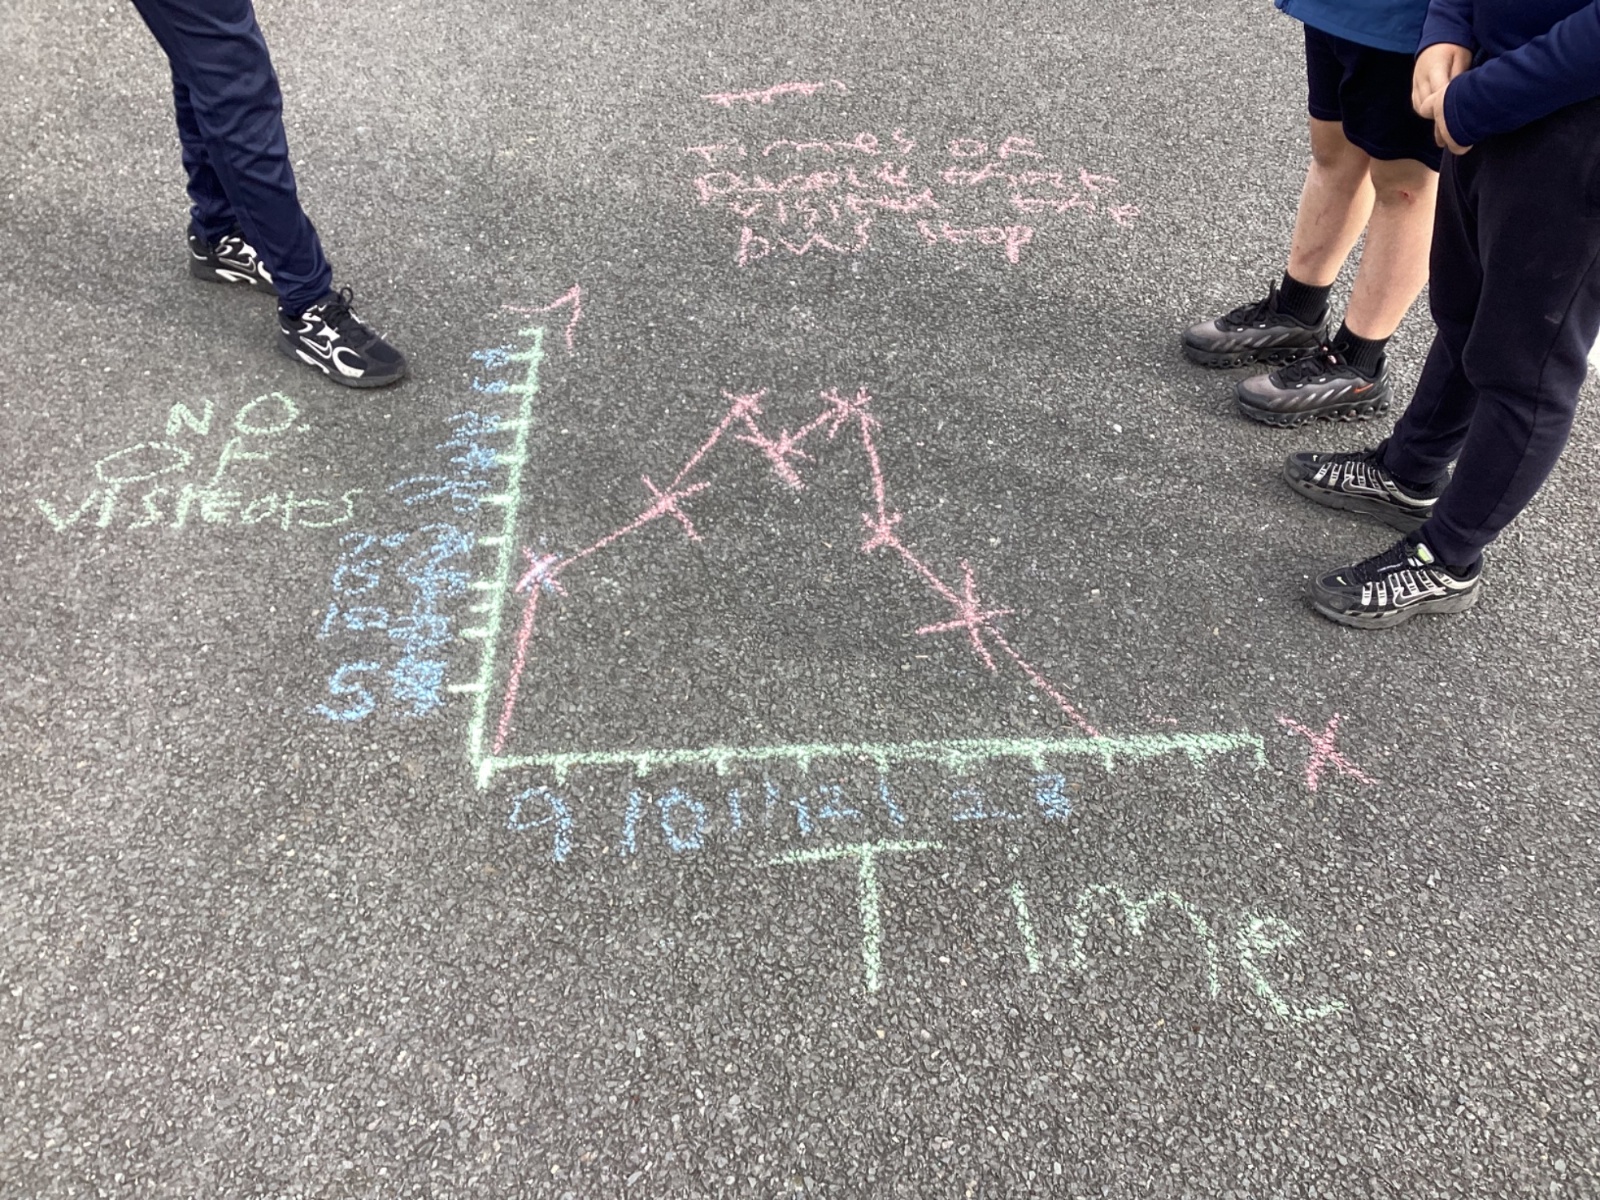
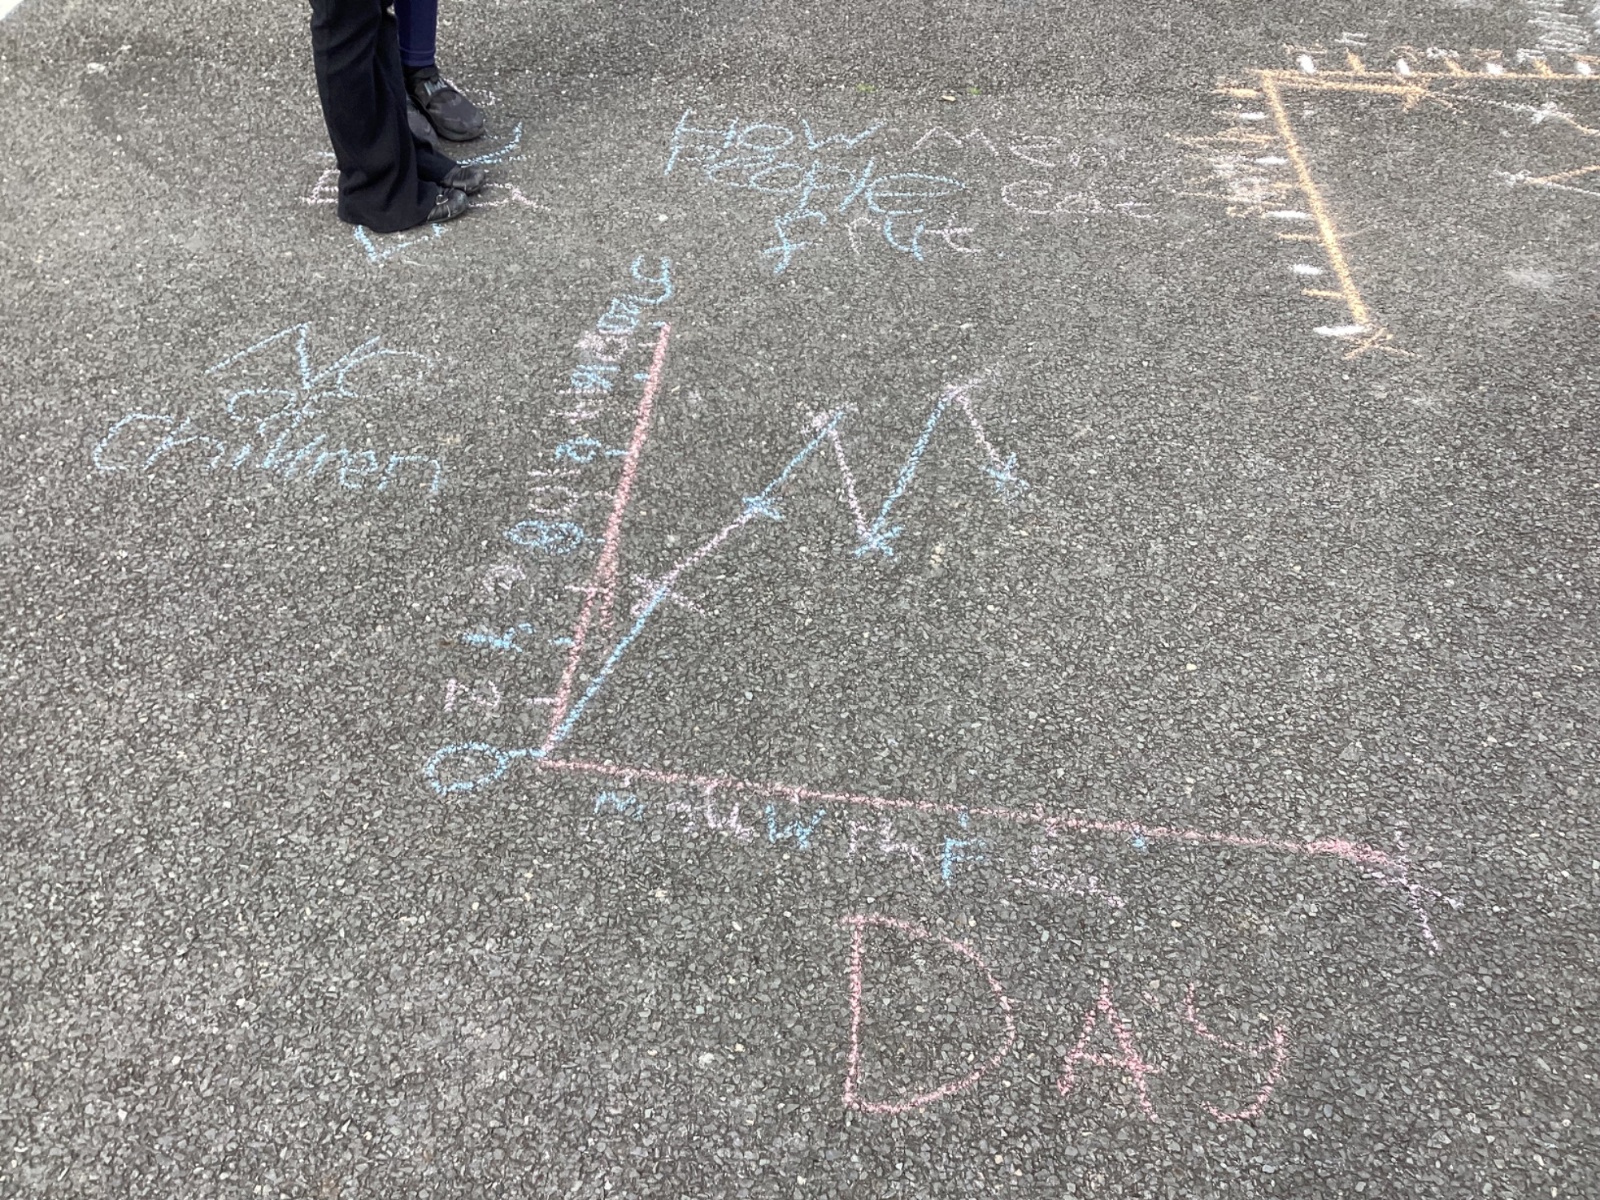
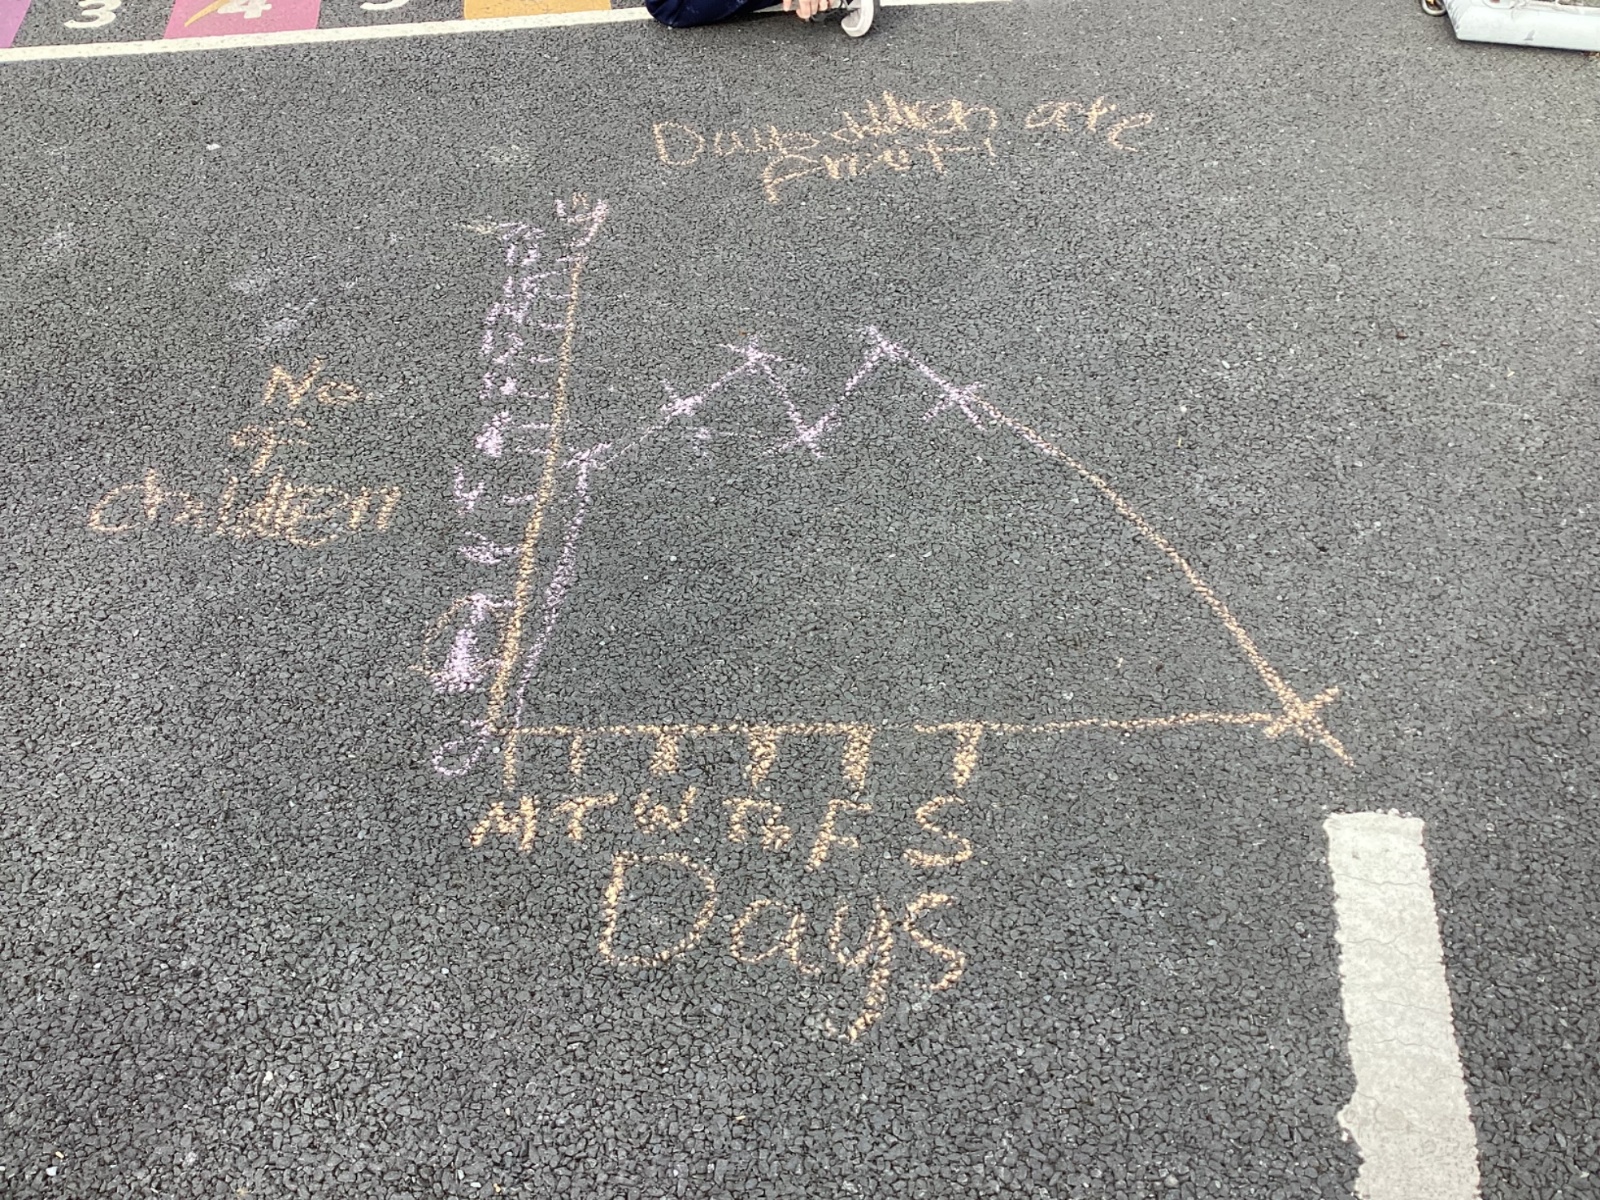
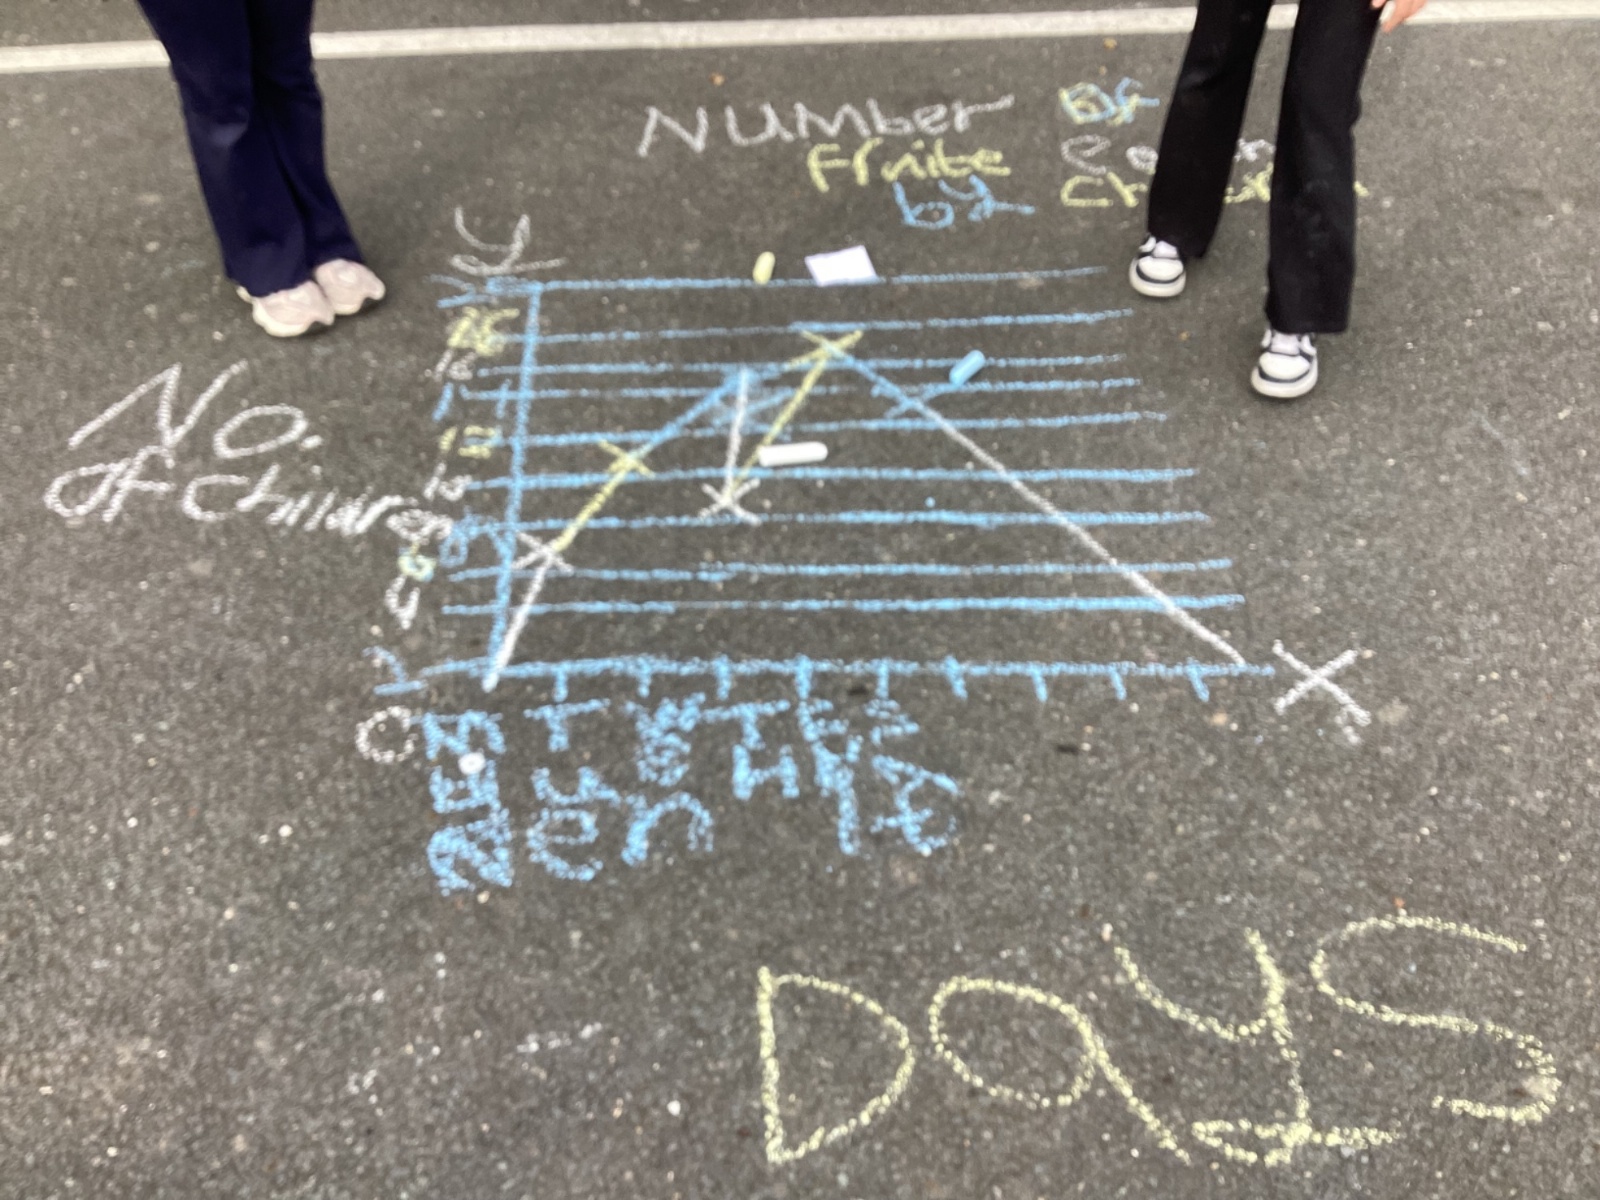
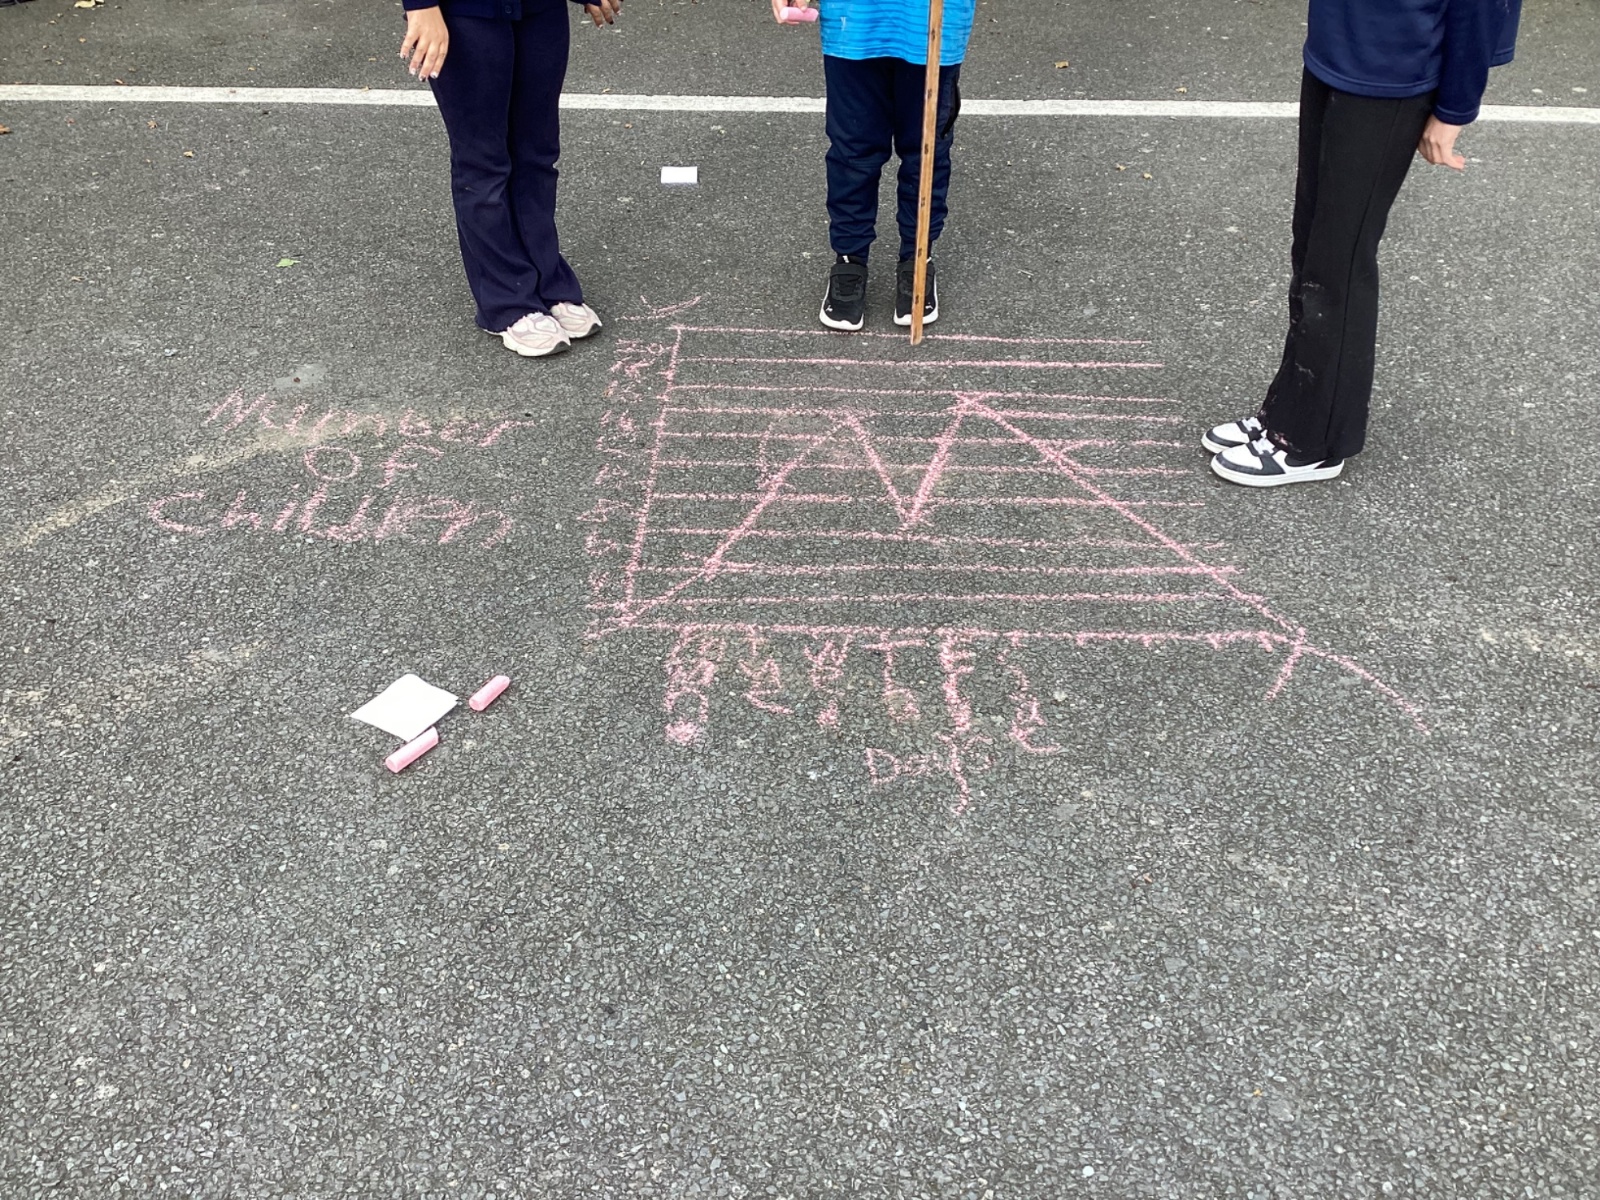
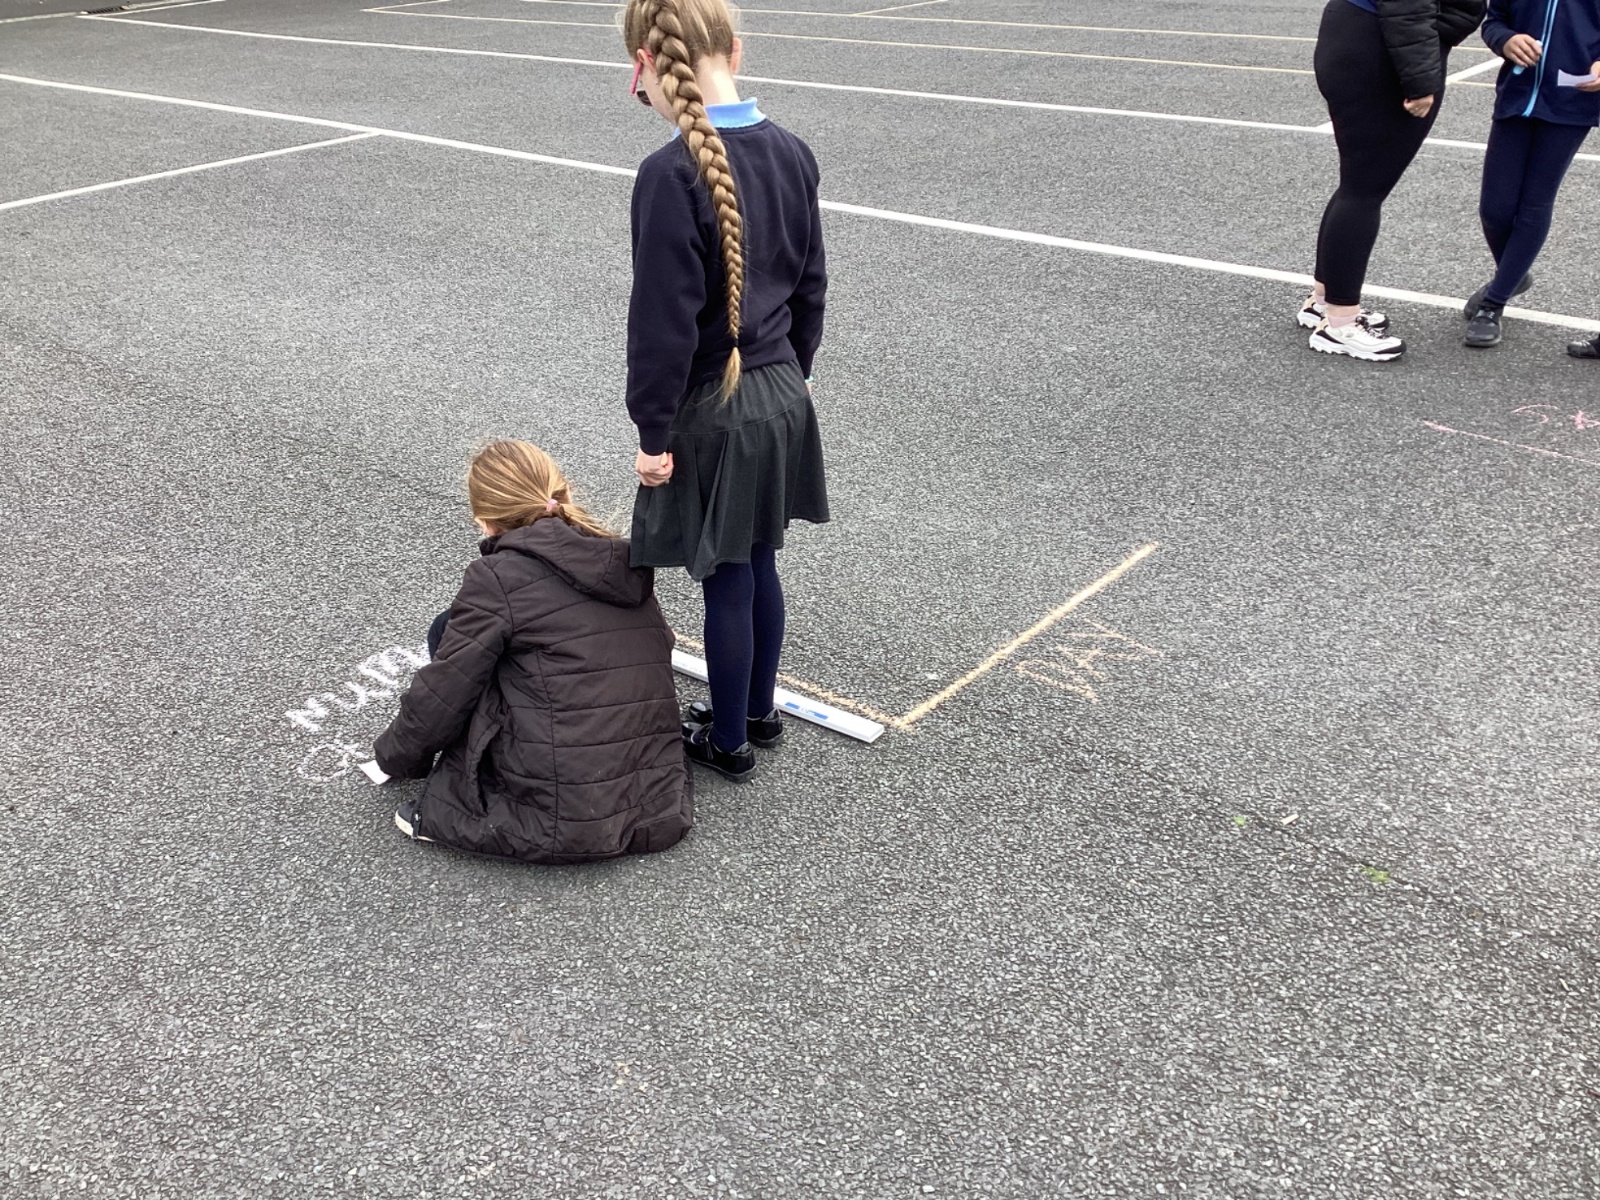
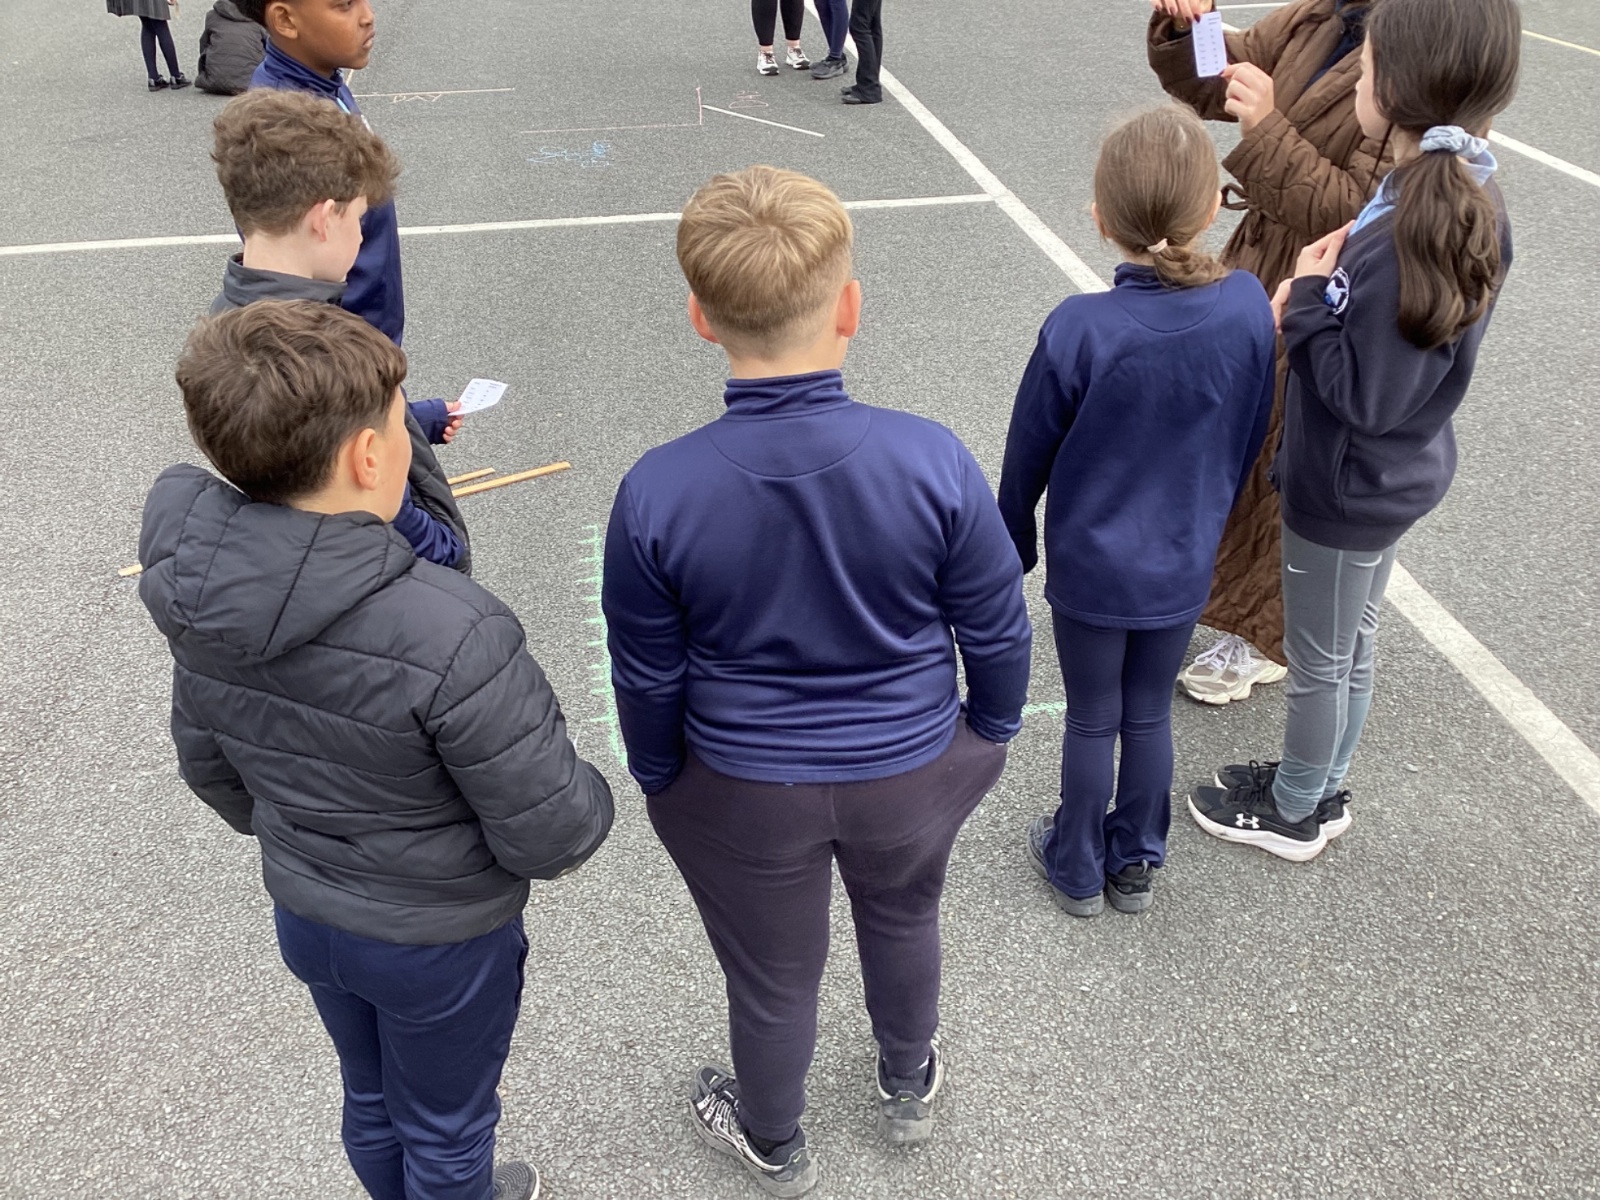
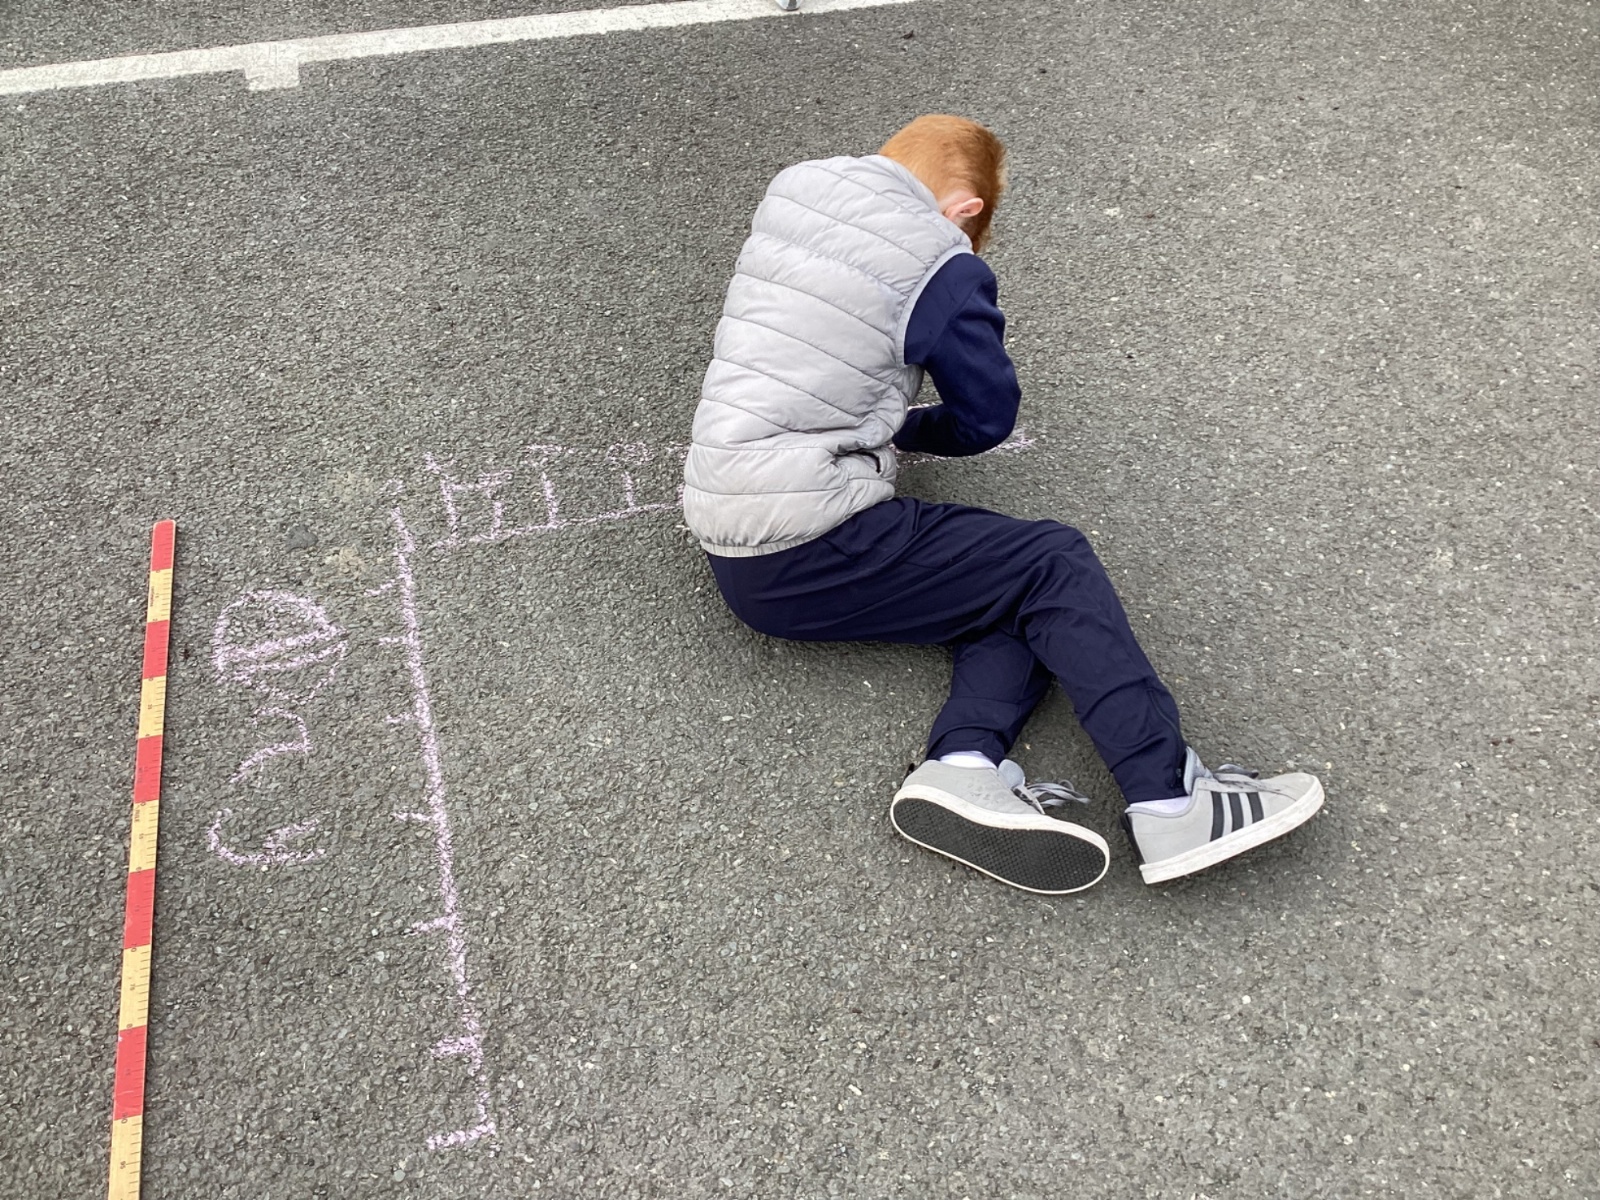
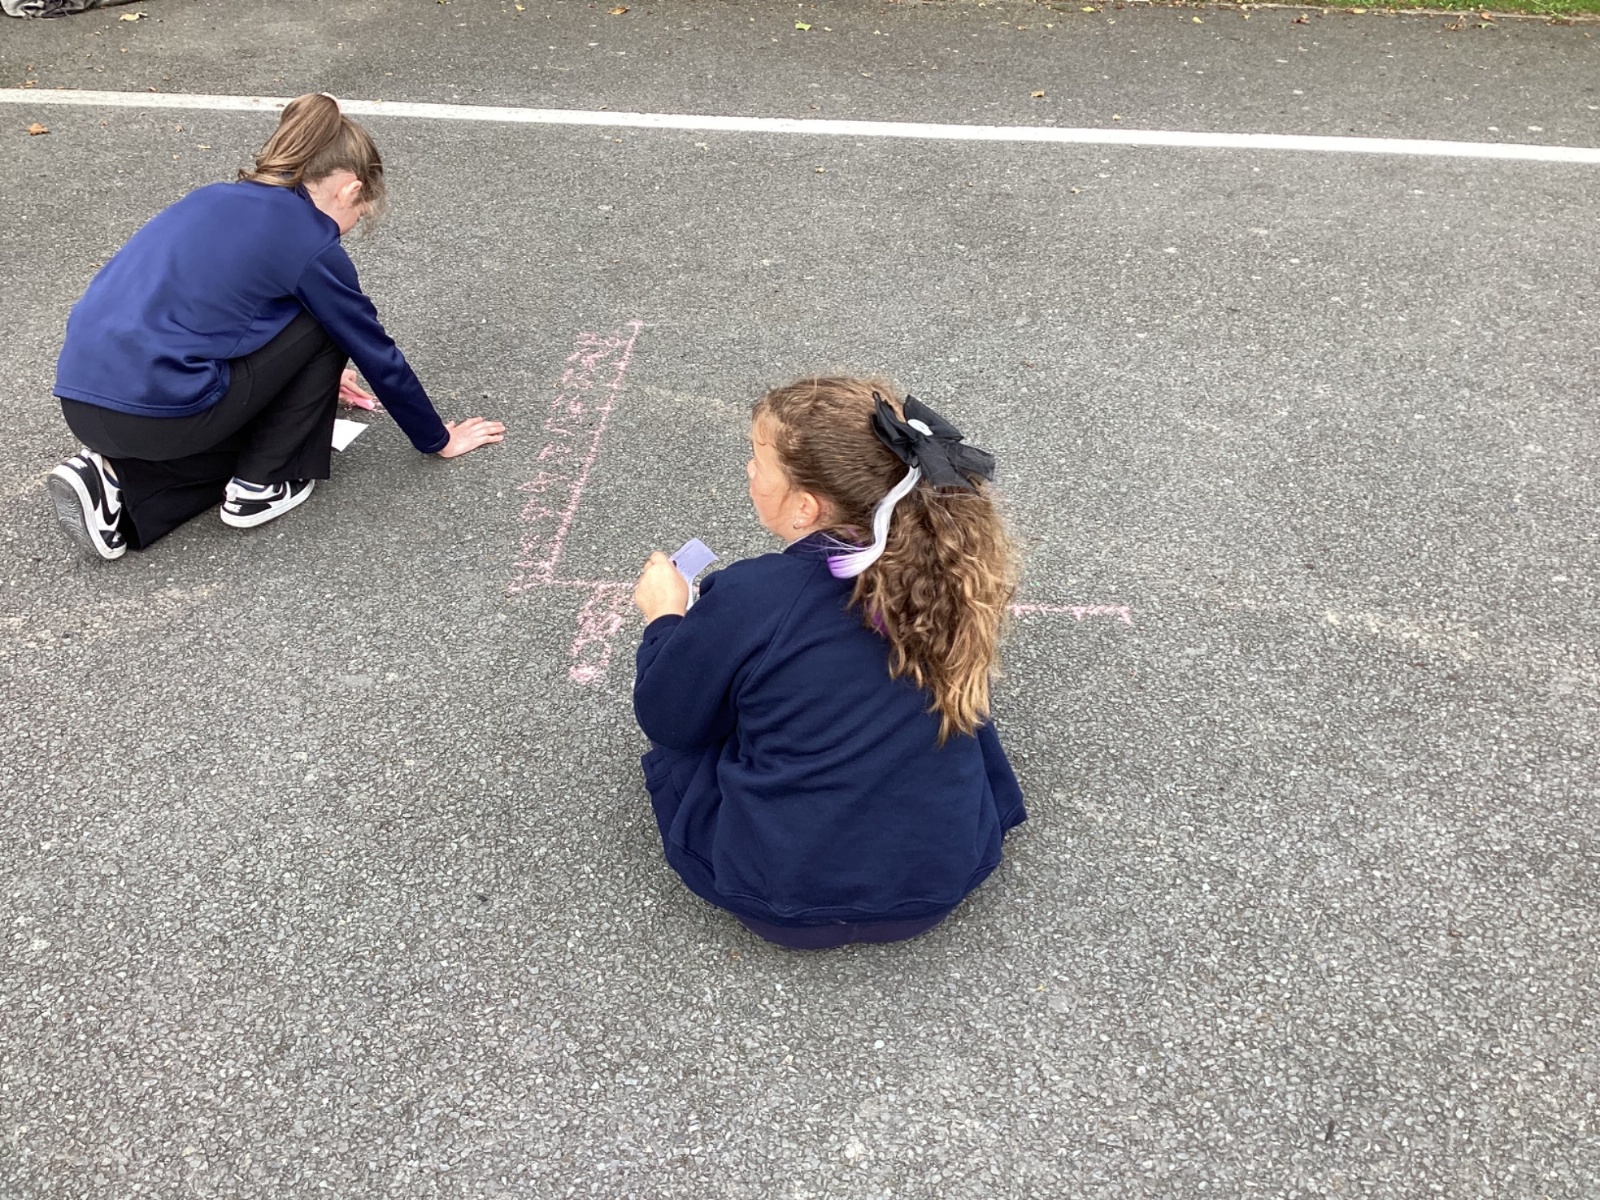
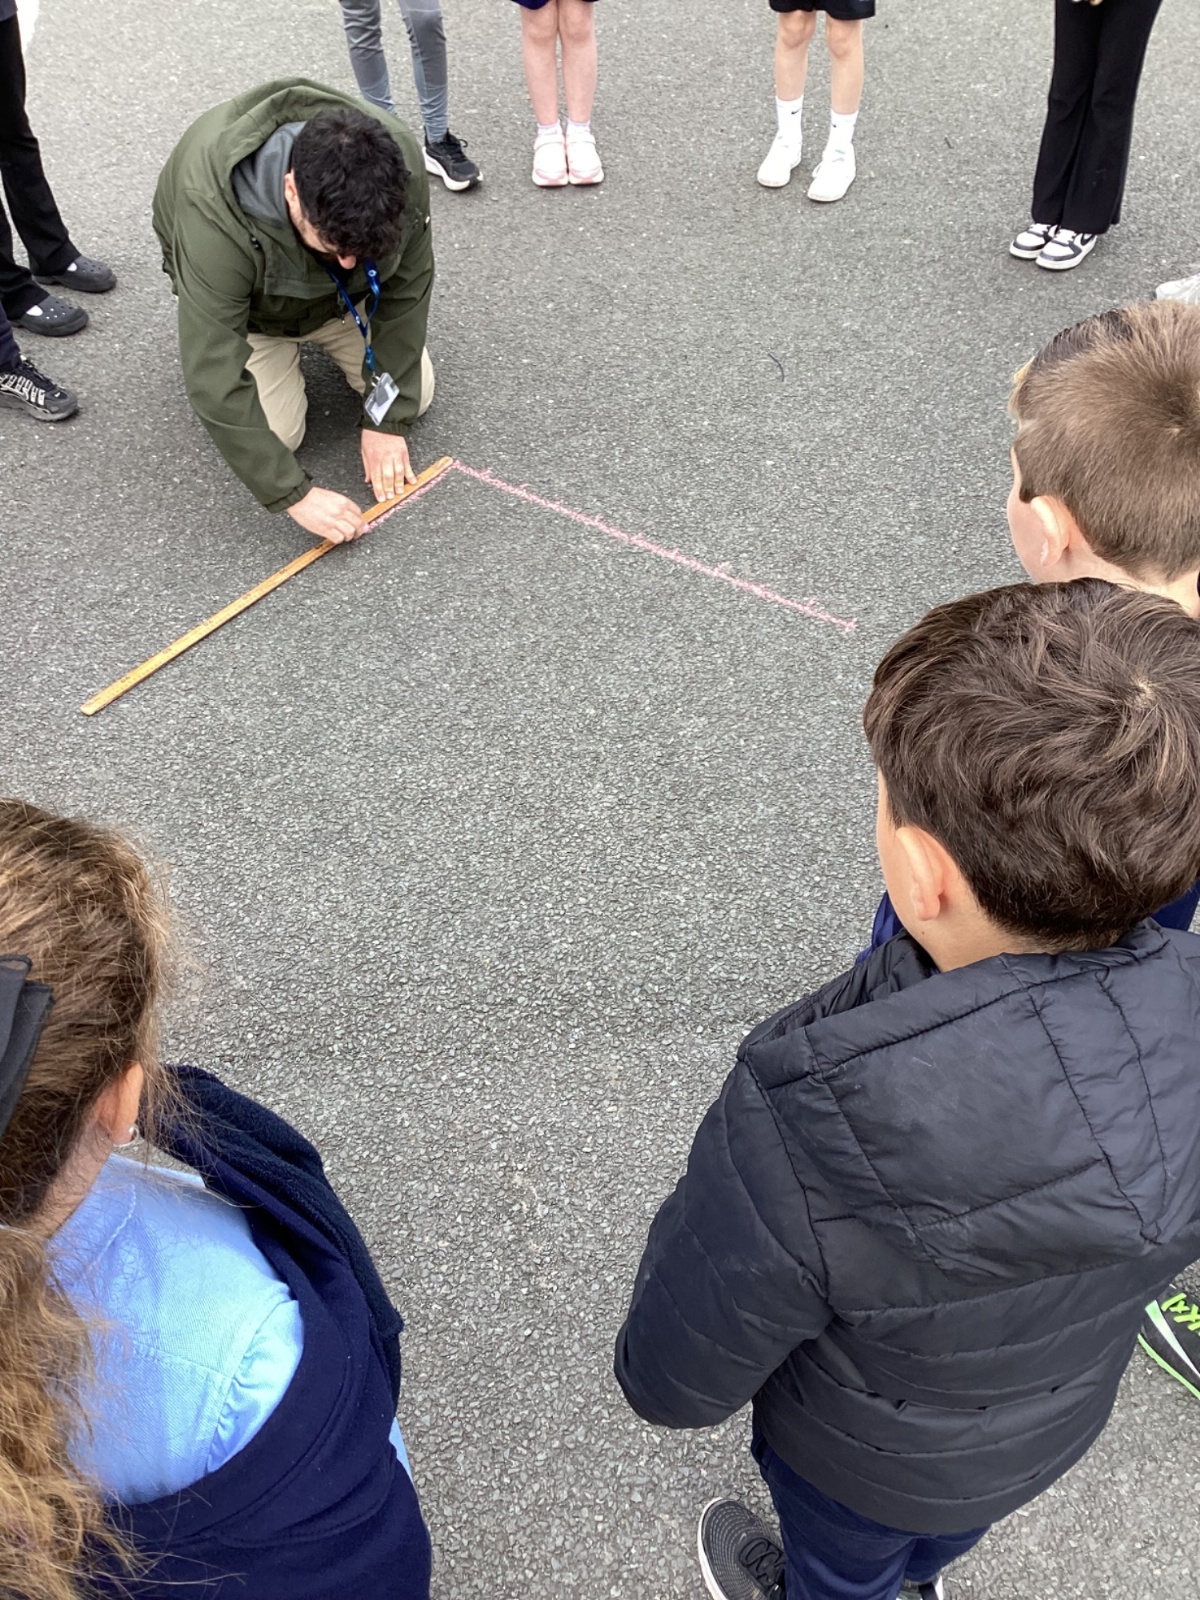
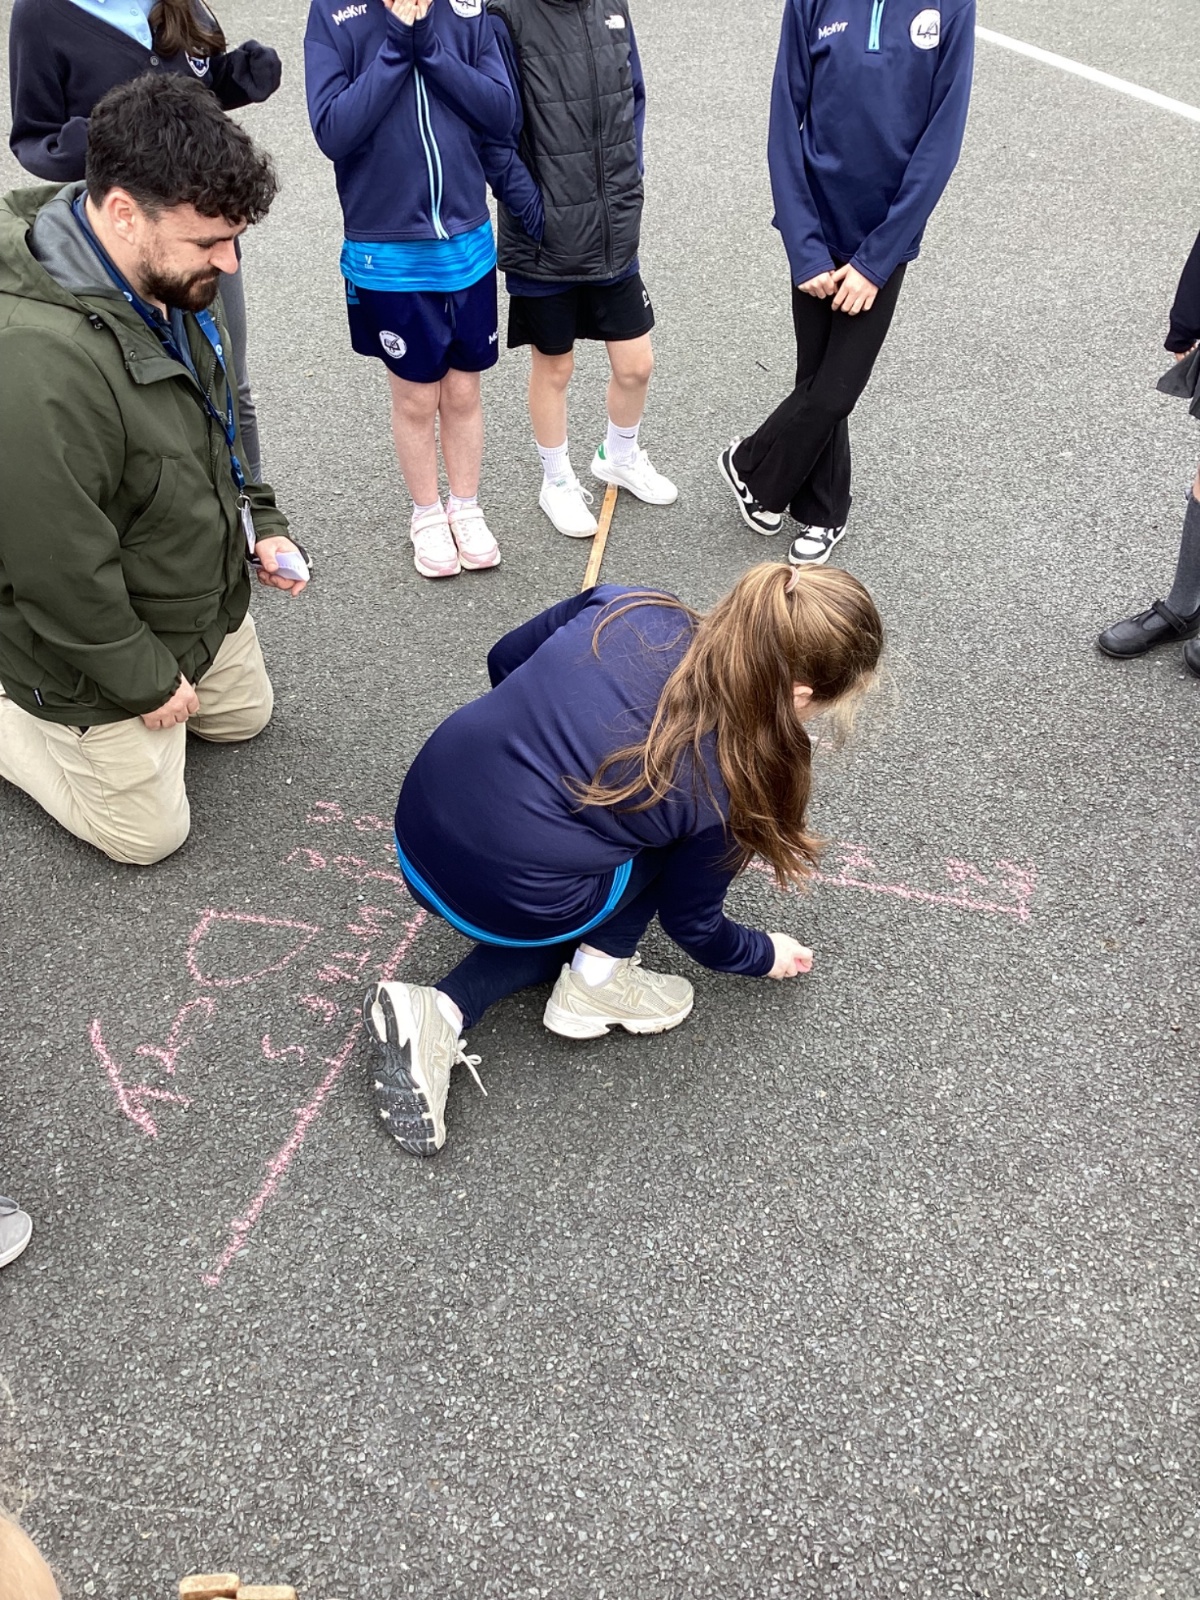
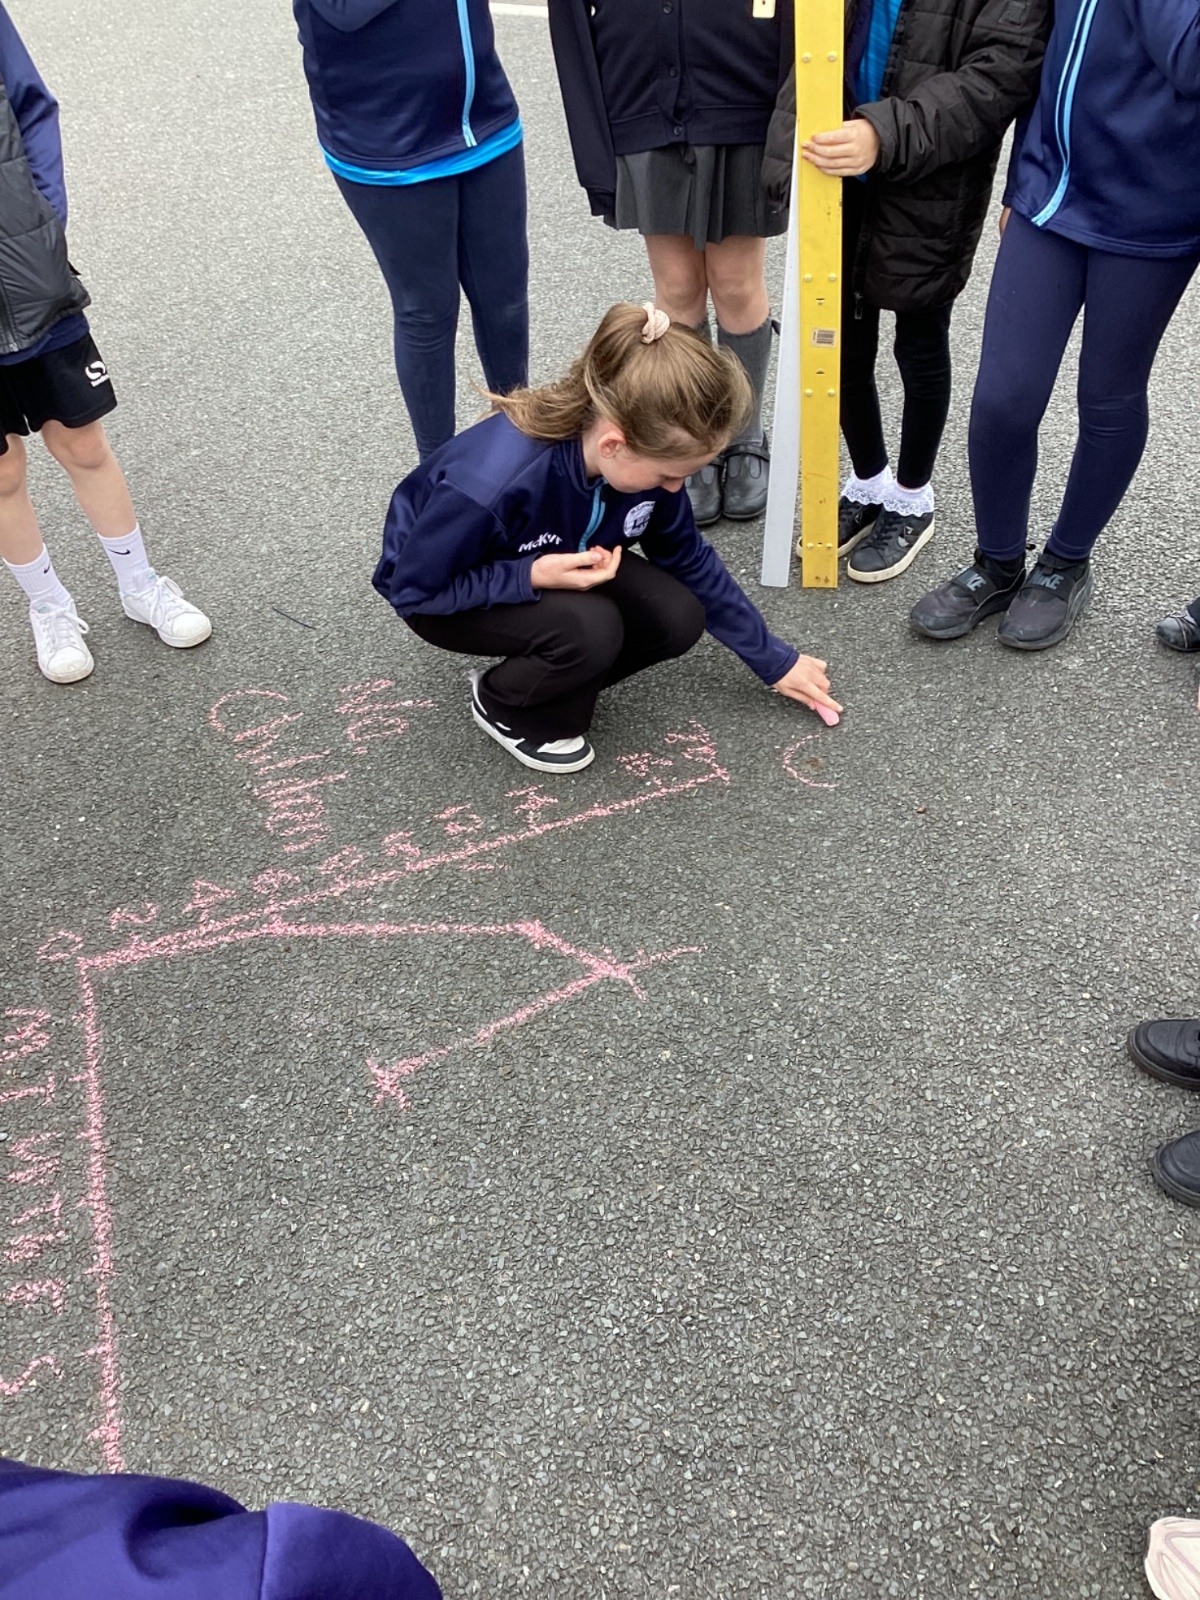
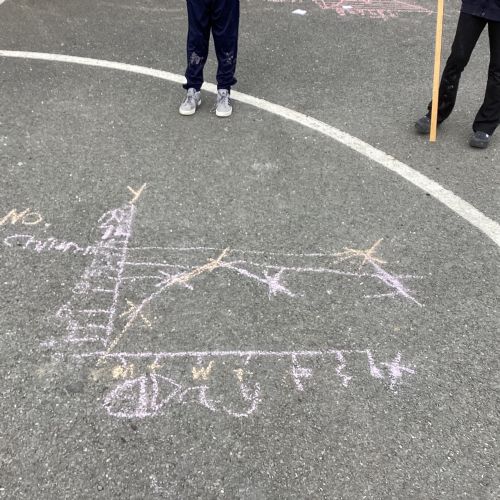
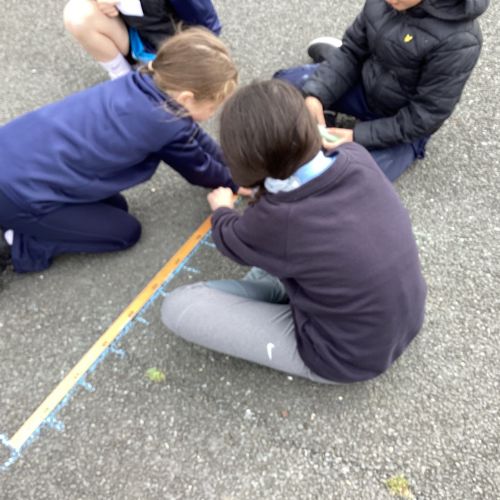
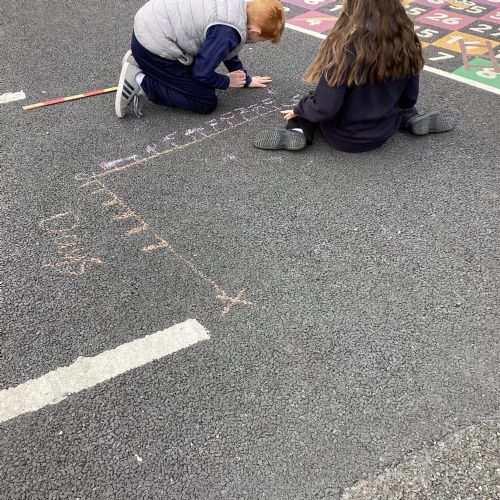
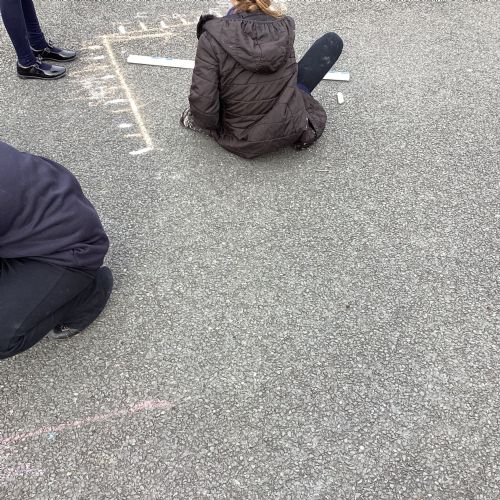
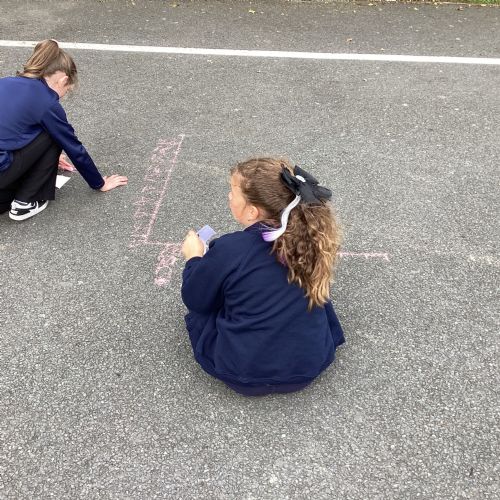
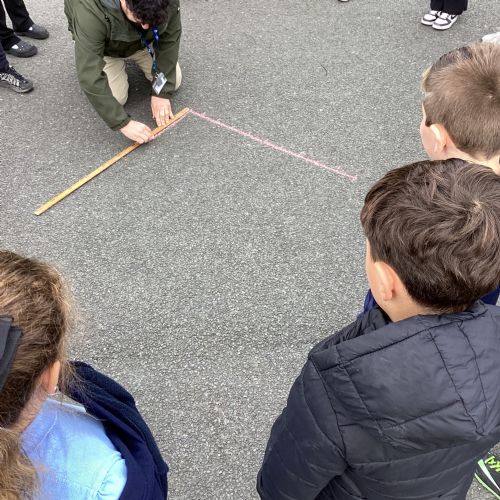
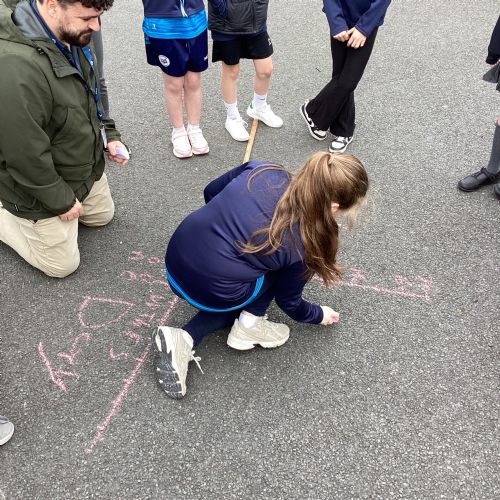
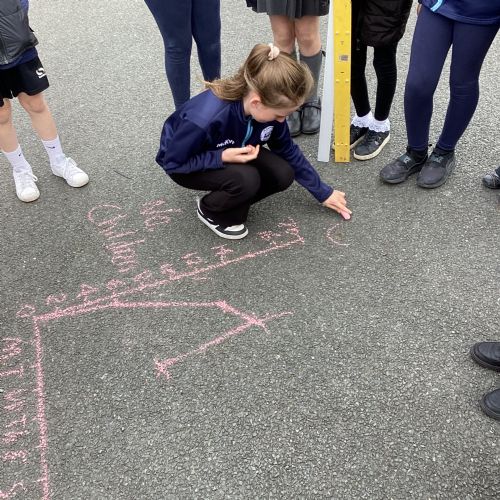
Today we took our learning outdoors! We began by discussing the key features of a line graph, including the title, axes, labels, scale and plotted points. We then worked in groups and used tally charts we had previously created in class to construct our own large line graphs outside. This practical activity helped us understand how data can be transferred from a tally chart and represented clearly on a line graph.
 IMG6061.jpeg40747
 IMG6062.jpeg40746
 IMG6063.jpeg40745
 IMG6064.jpeg40744
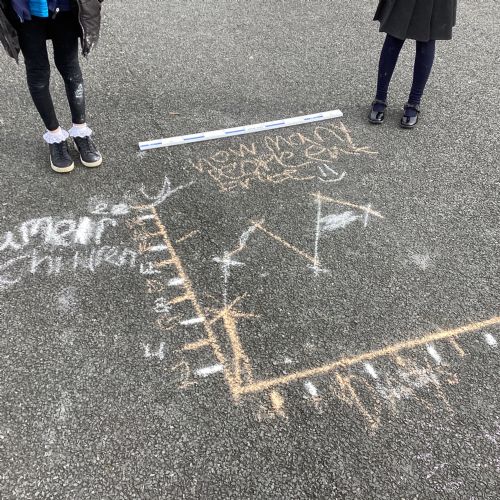 IMG6065.jpeg40743
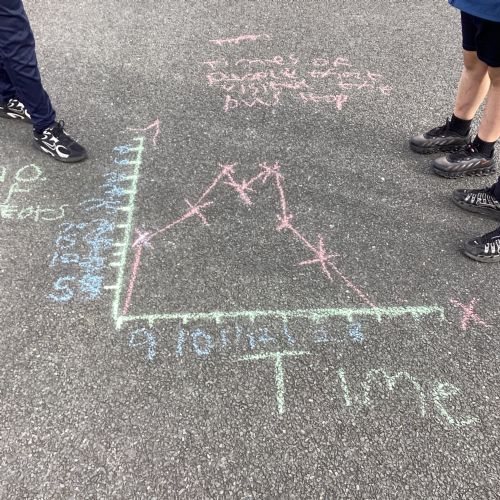 IMG6066.jpeg40742
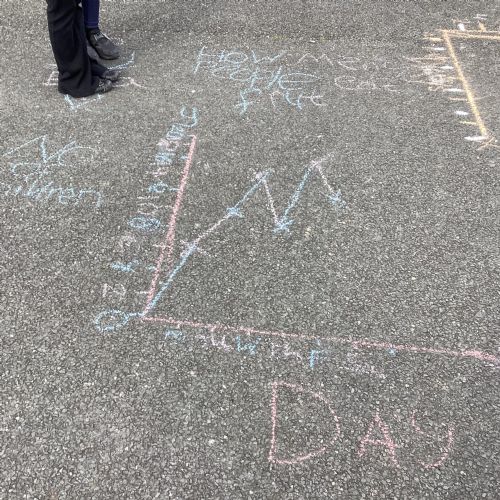 IMG6067.jpeg40741
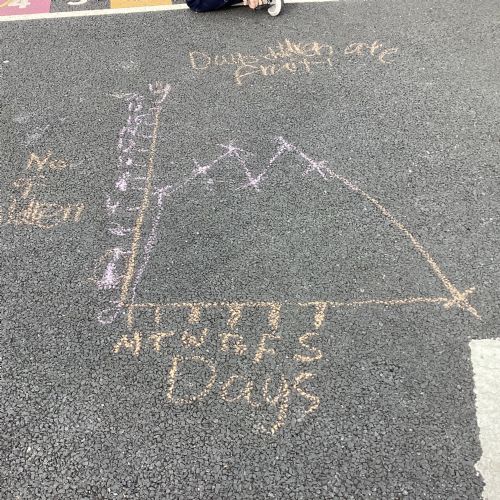 IMG6068.jpeg40740
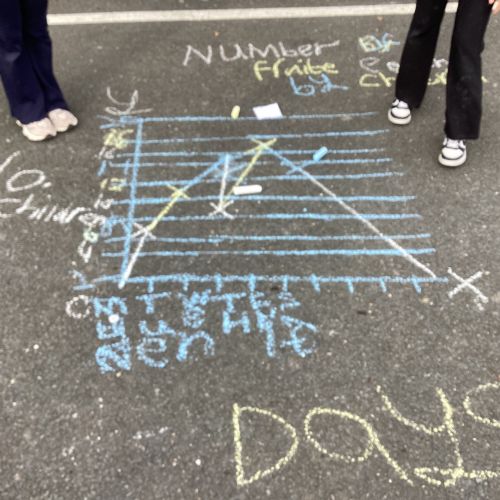 IMG6069.jpeg40739
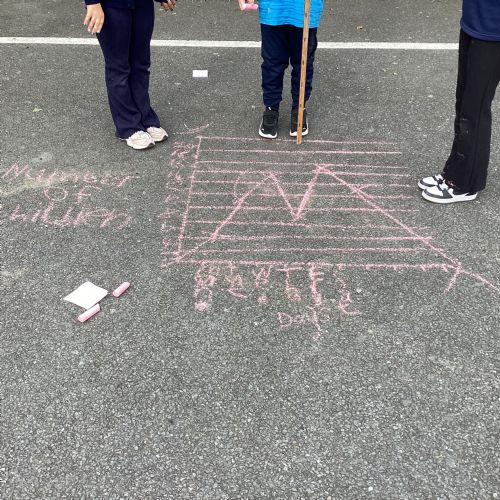 IMG6060.jpeg40748
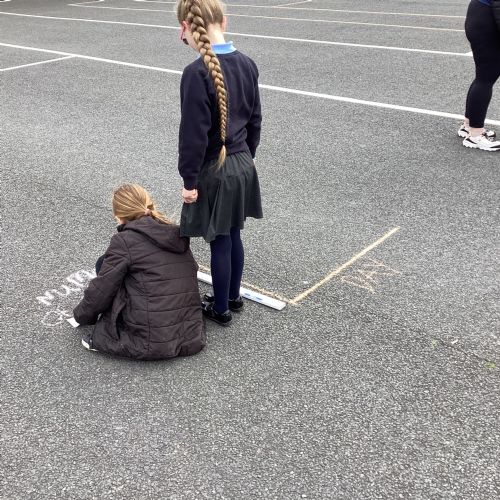 IMG6059.jpeg40749
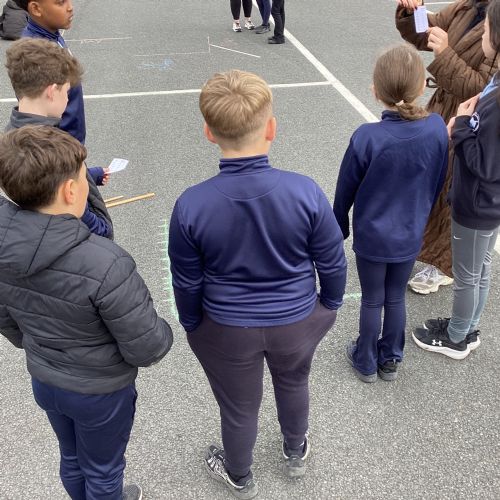 IMG6058.jpeg40750
 IMG6057.jpeg40751
 IMG6056.jpeg40752
 IMG6046.jpeg40753
 IMG6049.jpeg40754
 IMG6051.jpeg40755